


Employee Reports help you keep track of employee timesheets, plan resource allocation and assess productivity.

The Employee Listing Report shows a list of employees and if Show Detail is checked, the list will show employee profile information.

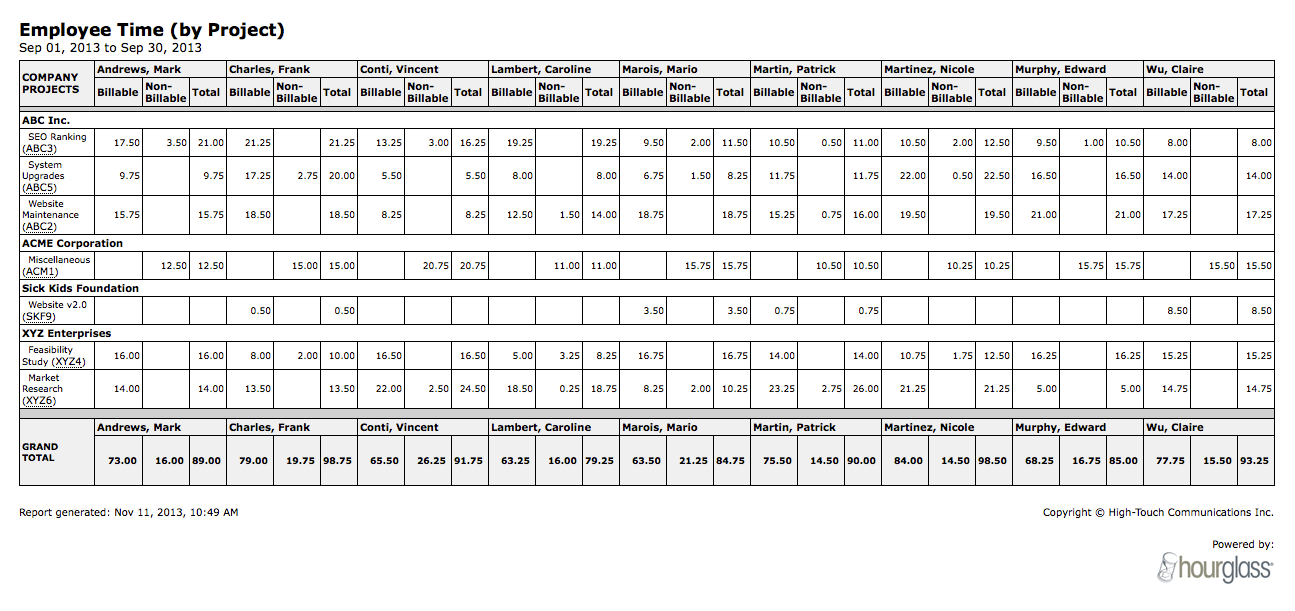
The Employee Time (by Project) Report shows a breakdown of Employee Time per Project for a user-defined period of time - start and end dates are usually Monday and Friday of a week, however, they can be any dates.
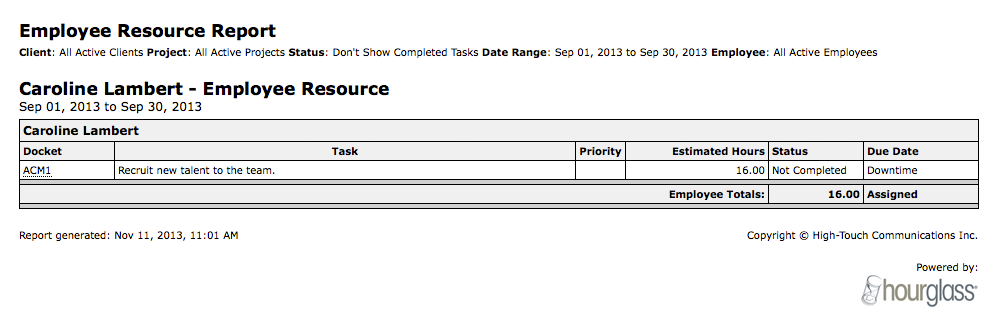
The Employee Resource Report shows which Tasks have been assigned in a per-Employee listing, with hour estimate totals for completed tasks and tasks remaining, for a user-defined period of time.
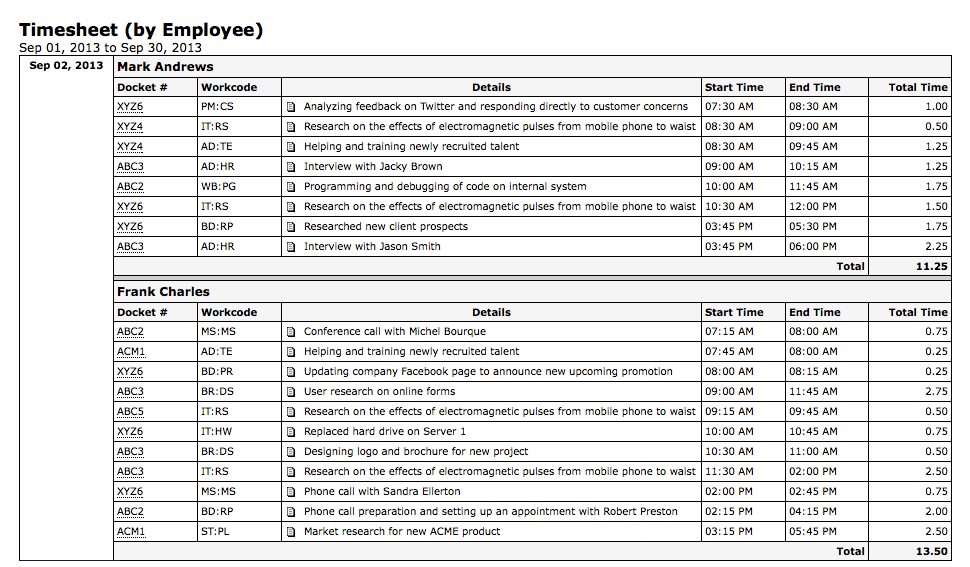
The Timesheet (by Employee) Report shows timesheet entries for a user-defined period of time, broken down by date and Employee.
The Employee Billable Ratio Report shows the ratio of billable to non-billable activity on a per-Employee basis, for a user-defined period of time, broken down by Client and Project, plus an overall billable percentage for the entire Company.

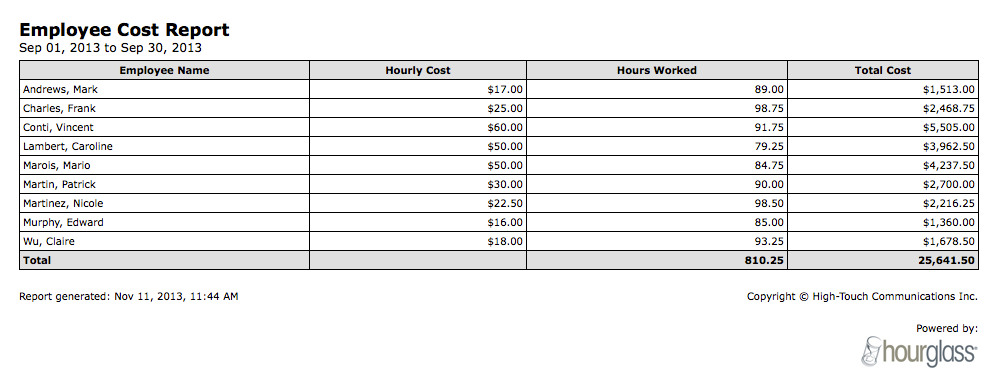
The Employee Cost Report shows the cost of an Employee for a user-defined period of time.
| To learn more about the different reports HourGlass offers, visit the following pages: |